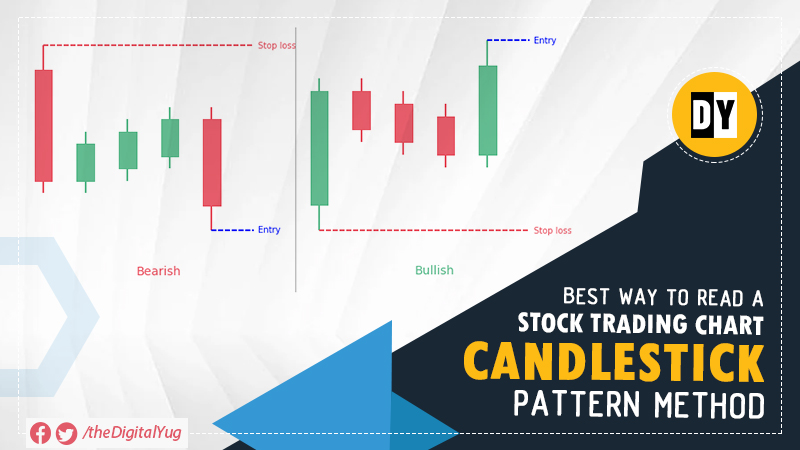
Best Way to Read a Stock Trading Chart: Candlestick Pattern Method
Learning to read candlestick charts is an impressive start for a stock trader who wants to gain some more in-depth knowledge about how to read charts.
Before starting to read a candlestick chart, you must know some candlestick terminologies. Here are most of the essential candlestick terminologies that will help you to understand candlestick charts better.
Candlestick Chart: Introduction
Stock candlestick charts provide a variety of information about currency price movements. Trading Stocks with candlestick is a fruitful skill that can be used for other assets as well. Every candlestick shows price movement for a specific time that could be 1 minute, 1 hour, one day, one month, and so on.
Candlestick charts are used to track asset prices of all types of financial markets. These markets include commodities, FOREX, indices, treasury, and stock markets. Stocks show the largest number of traded financial instruments. Prices where this instrument is traded recorded and displayed graphically by the candlestick chart. Candlestick chart is one of the most common price representation methods.
Chart Analysis
Candlestick chart analysis is an important skill for traders. The candlestick chart is used to plan the price of financial instruments through technical analysis. Individual candles and their patterns can interpret graphical analysis. Bullish candlestick patterns can be used to start old trading, while bearish candlestick patterns can be used to start short trading.
Candlestick Terminology
- Open price The open price is the very first price traded during the creation of a new candle. If the price starts to move upwards, the candle will turn blue or green, and if the price moves downwards, the candle will turn red (colors may vary depending upon settings).
- Close Price Close price is the last traded price during the time of the candle creation. If the stock's close price is below the open price, the candle will become red, and if the close price of a stock is above the open price, the candle will be blue or green (colors may vary depending upon settings).
- The Wick Wick is an essential part of a candlestick & is also known as the shadow. Wicks are significantly thinner than the body of a candlestick. These are important as they show the extremes in the price for a certain charting period.
- High Price The top of the shadow or wick shows the highest price traded during the time. If there is no upper shadow or wick, it means that the open price or the close price was the highest price traded.
- Low Price The lowest price traded is either the price at the bottom of the lower shadow or wick, and if there is no lower wick or shadow, then the lowest price traded of a stock is the same as the close price or open price in a bullish candle.
- Directions The color of a candlestick shows the direction of the price. A candle will turn green if the price of the candle is closing above the opening price of the candle, so in this case, the price is moving upwards. On the contrary, if the price closed below the open, then the candle will turn red.
- Range The range is the simple difference between the highest price point and the lowest price point of a candle. The below-mentioned formula can calculate it:
Formula: Range = Highest price point – Lowest price point
2 Top Methods to Read a Stock Candle Chart
There are various ways to read and use a candlestick chart. Candlestick chart analysis depends upon your preferred trading strategy and time frame.
- Remembering the Price Patterns of Different Candles Candlestick charts help the investors or traders to remember the price patterns that occur in the charts. You can take advantage of these candlestick patterns by using them to know the entry and exit signals of the market.
For example: Take the bullish engulfing pattern. The bullish engulfing is a combination of two candles in which the second candle 'engulfs' the first candle. It is a signal that it could be the end of a currency pair established weakness. A trader/investor will take advantage of this by entering a long position after the second candle closes.
- Explaining Single Candle Formations Every candlestick offers tons of information and insight into the current market. Some candlesticks such as the hanging man, hammer and shooting star show signals of changing momentum and help know where the market prices may trend potentially.
Understanding Candlestick Patterns
Candlestick chart creates patterns due to similar investment sentiments and repeating supply & demand scenario. While it is known that every candle has good information, it is also imperative to read the previous and next candles. There are majorly two types of candle patterns, namely:
- Bullish Pattern Some candlesticks show bullish patterns, and the retail traders should initiate the buying after confirming it. The bullish pattern candles to detect are:
- i. Inverse Hammer Pattern
- ii. Hammer Pattern
- iii. Morning Star Pattern
- iv. Bull Engulfing Pattern
- v. Piercing Line Pattern
- vi. Three Soldiers Pattern
- Bearish Pattern Some candlesticks show the bearish patterns, and the retail traders should initiate the selling after confirming it. The bearish pattern candles to detect are:
- i. Hanging Man Pattern
- ii. Shooting Star Pattern
- iii. Bear Engulfing Pattern
- iv. Evening Start Pattern
- v. Black Crows Pattern
Bottom Line
Most of the online Stock brokers generally offer candlestick charts along with their trading software. If you are also looking for a broker where you can see candlestick charts, Zerodha & Upstox are good options. They have all kinds of candlestick patterns to read.

Also Read
Cryptocurrency Advance Trading Guide: Top 9 Candlestick Patterns

